LSCT: PREDICTING AND MONITORING PERFORMANCE
Multivariate analysis
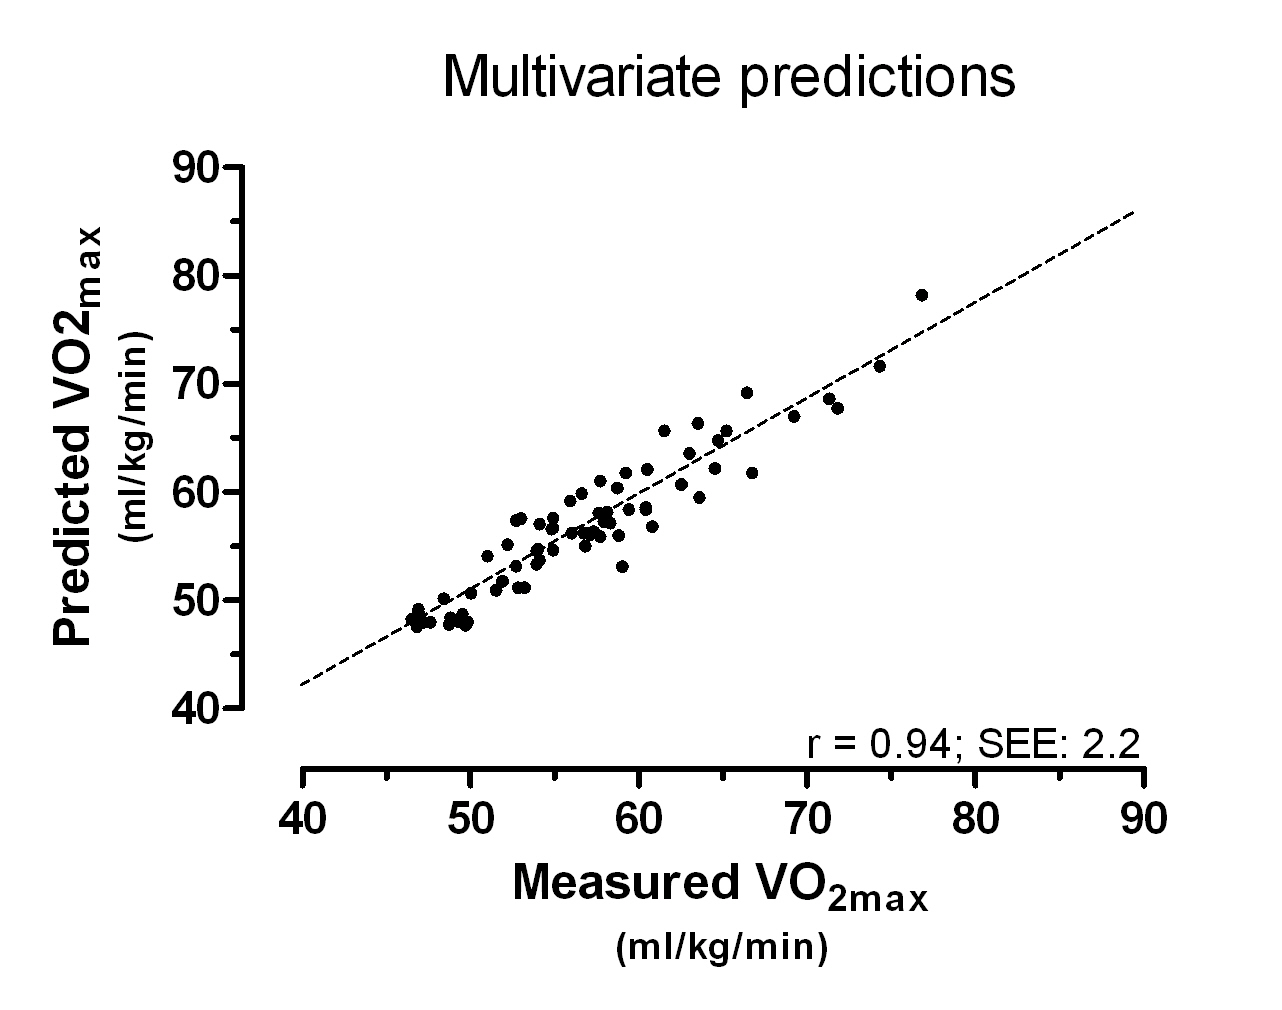
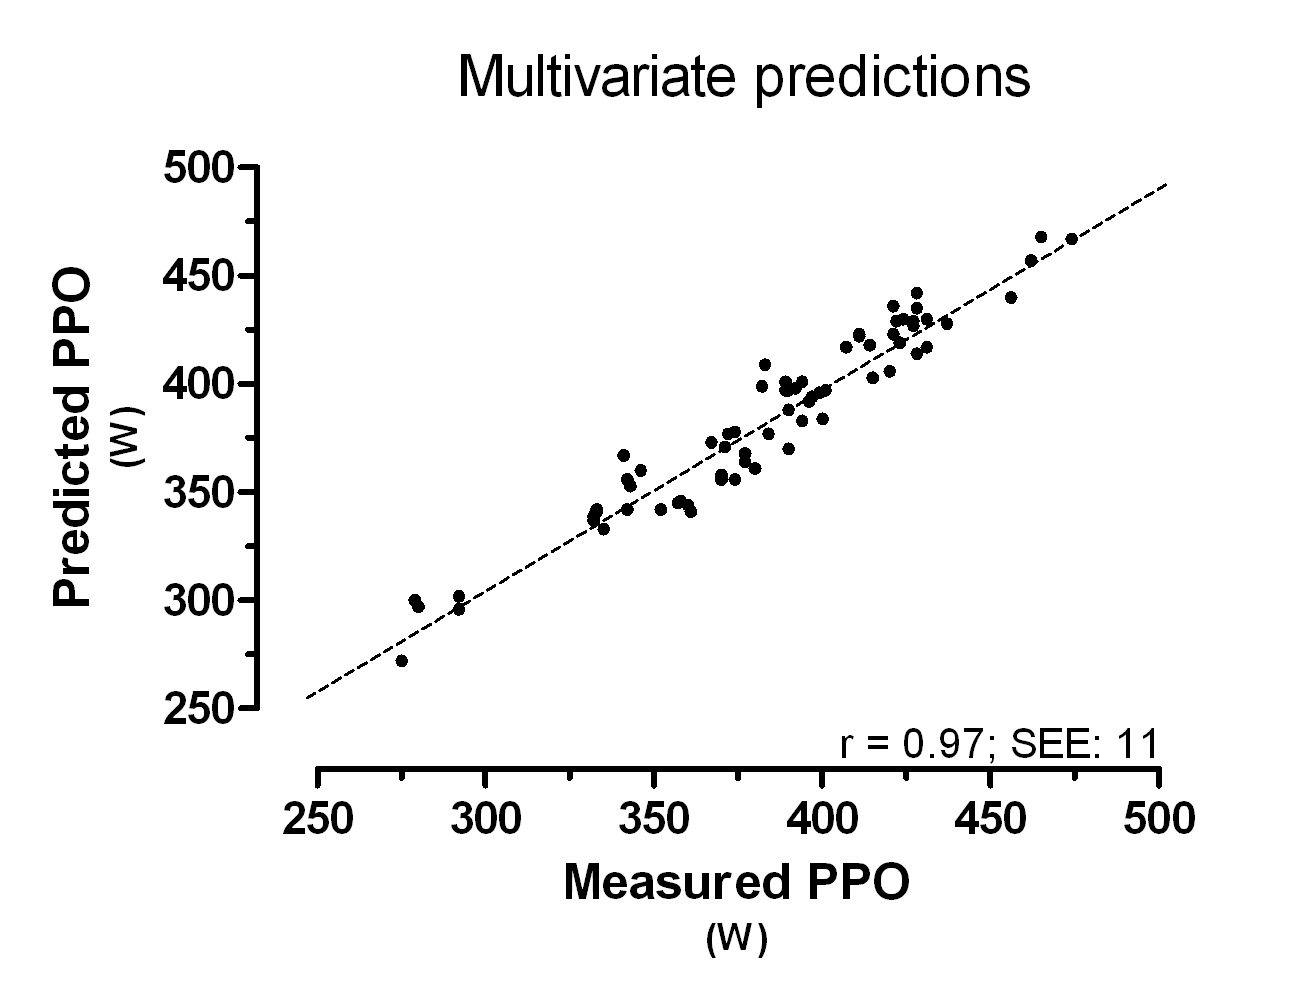
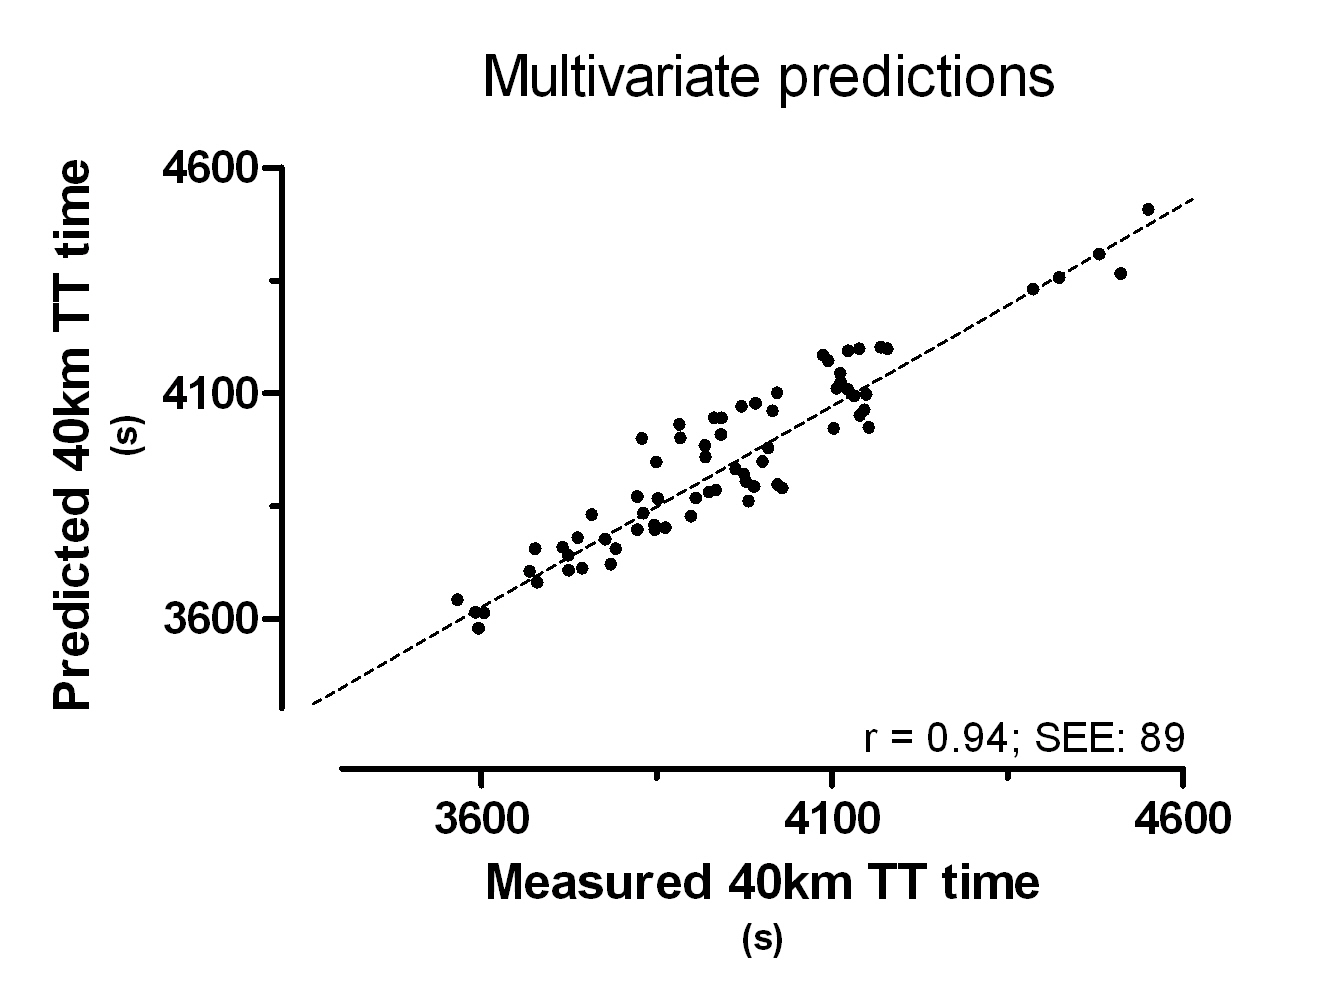
Based on the traditional performance parameters measured within the LSCT plus additional new parameters, we successfully have been able to further improve the sensitivity of the LSCT. These findings will allow us now to also use the LSCT in PRO-TOUR cycling teams.


Figure 1. Realtionship between LSCT predicted and the actual VO2max
Figure 2. Realtionship between LSCT predicted and the actual PPO

Figure 3. Relationships between LSCT predicted and actual 40km TT time
Mathematically modelling
Although good relationships between parameters measured within LSCT and maximum oxygen uptake (VO2max)/ peak power output (PPO)/ 40km time trial performance (40km TT) have been published by Lamberts et al. (BJSM 2011), additional mathematically modelling have further improved the sensitivity of the LSCT making it possible detect small meaningful changes in professional cyclist.
Due to commercial reasons the additional added parameters and their allometric scaling values won't be publicly available.
Basic relationships between the LSCT and cycling performance and can be found under the heading 'Interpretation of the LSCT'
